
- How did your model fare?
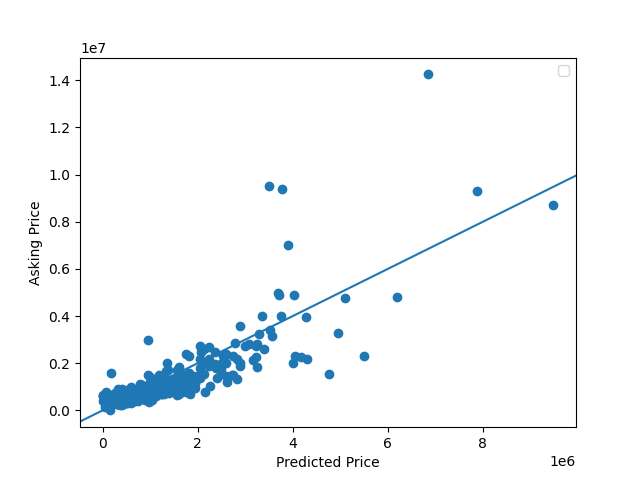
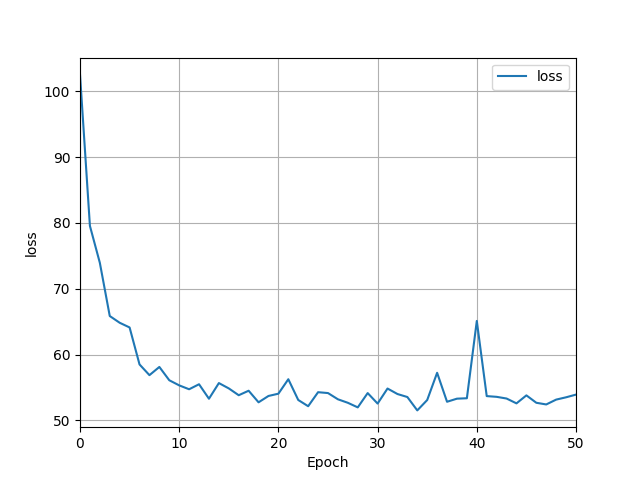
- The loss of my model ended up being around 53.96, and by looking at the graph, it is clear that the predicted and actual prices have a fairly strong positive correlation. The mse on the standardized values (divided by 100,000) was around 51.87, which shows that some of the predicted vales were much higher than the actual home values, so it was not close to being a perfect model.
- In your estimation, is there a particular variable that may improve model performance?
- I think standardizing all of the data with a uniform scaler could lead to better results and splitting the data into testing, training, and validation splits can also help. If the model had more data to train on (I chose 500 houses), then it could possibly achieve better results as well.
- Which of the predictions were the most accurate? In which percentile do these most accurate predictions reside?
- Typically, the model was better at predicting house prices that were less expensive. Once the asking price increased above about 2,000,000, the model became less accurate and tended to predict the price to be higher than it actually was probably because there were less houses in the training data with prices this high. The most accurate predictions are between the first quartile and the median of the data.
- Which features appear to be the most significant predictor?
- Bedrooms and living areas seem to be the best predictors because he model seemed to put too much weight on the number of bathrooms. If there were more bathrooms, it would predict the price to be way higher than it actually was. Number of bedrooms and amount of living space played the biggest role in determining the actual and predicted price.